Kenyan exports to EAC decline

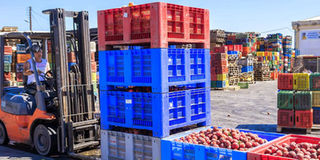
Imports from the Comesa, for instance, accounted for 57.5 per cent of total value of imports from Africa. Uganda and Egypt were the dominant sources of imports, with a combined value of $774m. FILE PHOTO
What you need to know:
- Exports to Africa. Kenya’s exports to Africa continued to fall for the second year to $2.23b in 2017. The trend in total exports to Africa was consistent with the performance of total exports to Comesa, which declined by 2.2 per cent to $1.66b.
The value of total exports to Comesa accounted for 74.3 per cent of the value of total exports to Africa.
Nairobi. Kenya’s exports to the East African region fell to $1.14b last year from $1.21b in 2016, largely due to a slowdown in the performance of manufacturing sector and persistent trade disputes with Tanzania.
The Kenya National Bureau of Statistics (KNBS) Economic Survey 2018 shows that Kenya’s trade with East Africa member states dropped from $1.26b in 2015.
Uganda, Kenya’s biggest regional market, sliced its imports from Kenya to $618m from $622m the previous year. Exports to Rwanda also dropped to $171m, from $175m in 2016.
Tanzania recorded the biggest cut in imports, from $348m in 2016 to $285m last year.
The manufacturing sector output volume declined by 1.1 per cent mainly on account of reduced production of food products, beverages and tobacco, leather and related products, rubber and plastics and non-metallic minerals.
Comesa imports
Cement exports to Uganda fell by 21.7 per cent. Other commodity exports to Uganda that recorded a decline in earnings were alcohol, phenols and their derivatives, salt, medicinal and pharmaceutical products and iron and steel products.
Nonetheless, East Africa remained the leading destination of Kenya’s exports, despite a 4.6 per cent decline in the value of total exports during the year.
“The decline in total export earnings from the East African Community is partly attributed to a reduction in the value of exports to Africa, since the region accounts for more than half of total exports to the continent,” KNBS said.
Kenya also registered the highest increase in imports from the continent — a 43 per cent jump to $2b — accounting for 11.6 per cent of the total import bill.
Imports from the Comesa, for instance, accounted for 57.5 per cent of total value of imports from Africa. Uganda and Egypt were the dominant sources of imports, with a combined value of $774m.
“Imports from Uganda more than doubled from $193m in 2016 to $420m in 2017 on account of increased import of milk and milk products, beans, animal feeds, maize and other unmilled cereals. The value of imports of these commodities accounted for 66.2 per cent of the total imports from Uganda in 2017,” KNBS said.
Uganda became the largest source of goods ordered by Kenyans, with food imports, mostly maize and other cereals, topping the bill.
South African exports to Kenya also rose from $499m to $619m, largely driven by an increase in the value of imported maize, iron and steel, motor vehicles and coal.
The maize imported from South Africa during the year was $77m, accounting for 19.1 per cent of the total import expenditure in 2017.
The increase in imports from Egypt was partly attributable to an increase in the value of soap and other cleansing preparations; paintings and drawings; paper and paperboard; computer monitors and projectors.
Exports to Africa. Kenya’s exports to Africa continued to fall for the second year to $2.23b in 2017. The trend in total exports to Africa was consistent with the performance of total exports to Comesa, which declined by 2.2 per cent to $1.66b.
The value of total exports to Comesa accounted for 74.3 per cent of the value of total exports to Africa.
But Kenya’s total export earnings from Asia continued to rise for the third year in a row to $1.62b last year driven by exports to the Far East, which grew by 23.5 per cent to $1.11b in 2017.


